Viewing Current OTDR Configuration
To verify what the current OTDR settings are, you can use the following CLI command:
show slots <slot #> config otdr <port #>
Example (RLA port 54):
RLS# show slots 1 config otdr 54
  slots:
  - name   : 1
    config:
      otdr:
      - name          : 54
        parent-port   : 54
        config:
          measure-time                  : 60
          event-range                   : 0
          office:
            pulse-office      : 30
            distance-office   : 8000
          short:
            pulse-short      : 1000
            distance-short   : 20000
          long:
            pulse-long      : 20000
            distance-long   : 128000
          loss-threshold-single         : 0.8
          loss-threshold-single-ranges:
            min   : 0.0
            max   : 2.1
          loss-threshold-all            : 3.0
          loss-threshold-all-ranges:
            min   : 0.0
            max   : 15.0
          reflection-threshold-single   : -33.0
          reflection-threshold-single-ranges:
            min   : -40.0
            max   : -27.0
          reflection-threshold-all      : -27.0
          reflection-threshold-all-ranges:
            min   : -40.0
            max   : -24.0
          wavelength                    : 1625.00
To view the the live settings, simply use the "inventory" variation of the same command as follows:
show slots <slot #> inventory otdr <port #>
Running an OTDR Trace (Office/Short/Long)
Use the following CLI commands to run office, short and long manual OTDR traces for ports 53 and 54 (RLA) or ports 53, 54, 63 and 64 (DLE):
start-otdr-trace name "slot-<slot #>-port-<port #>" trace-type <office|short|long|go-nogo>
Note: Only one trace can be run at a time so ensure a trace completes before starting another trace. If there is an OLF or Telemetry LOS, you may need to use the "handshake false" option, as seen below. For go-nogo traces for RAMANs you may also need to specify the raman name, where the port number must be the LINE-IN port.
start-otdr-trace name "slot-<slot #>-port-<port #>" trace-type go-nogo handshake false raman slot-#-port-6
Viewing OTDR Port Diagnostics
To view the latest diagnostic results of of an OTDR trace for a given slot and port, use the following CLI command.
show slots <slot #> inventory otdr <port #> diagnostic
Example: In this example we can see the diagnostic data for an office trace. The trace result, and response indicate it was successfully run, this is independent of loss/reflection events being detected. The trace time stamp tells us when the trace was run. The "monitored-diag-points" section of the output shows what diagnostic flags of importance along the physical path that the trace traverses have been set. In this scenario, we can see that slot 8 (an SRA) has an Optical line Fail diagnostic flag set to true.
RLS1# show slots 1 inventory otdr 54 diagnostic
  slots:
  - name   : 1
    inventory:
      otdr:
      - name   : 54
        diagnostic:
          handshaking-state   : idle
          pfg-name            : PFG-1-LINE-DEMUX
          local-line-port     : ciena-6500r-nodes:nodes RLS1 data slots 8 config port 6
          remote-line-port    : ciena-6500r-nodes:nodes RLS2 data slots 1 config port 63
          trace-types:
          - trace-type               : office
            requestor                : user-request
            is-handshake-requested   : true
            trace-result             : success
            trace-response-status    : success
            trace-event-status       : single-loss
            trace-time-stamp         : 2022-07-15T18:21:00Z
          monitored-diag-points:
          - name         : raman-olf
            slot-name    : 8
            facility     : ramans
            diag-name    : optical-line-failed
            instance     : LINE-IN
            point-type   : hw
Viewing OTDR Trace Results
OTDR can be run bi-directionally on RLS, which means the telemetry signal can be sent out both line Rx and Tx line ports of the given card. The following command can be used to show the events that were detected by the most recent (current) trace.
show slots # inventory otdr <port #> trace-event <long | short | office>,<current | baseline>
Example: In the example output below we can see the list of available traces using the following command.
CDC_EAST_65R4_0001# show slots 1 inventory otdr 54 trace-event

slots 1 inventory otdr 54 trace-event
+-----------------------------------------------------------+
| trace-type | trace-tag | trace-date-time      | num-event |
+-----------------------------------------------------------+
| long       | baseline  | 2023-02-14T18:14:00Z | 5         |
| office     | baseline  | 2023-02-14T18:33:00Z | 2         |
| short      | current   | 2023-06-14T19:41:00Z | 2         |
| office     | current   | 2023-06-14T19:42:00Z | 5         |
| long       | current   | 2023-06-14T19:43:00Z | 6         |
+-----------------------------------------------------------+
Following commands can be used to show more deeper container/list details about this object if they exist
show slots 1 inventory otdr 54 trace-event <key> [events]

CDC_EAST_65R4_0001# show slots 1 inventory otdr 54 trace-event
 long,baseline           long,current            office,baseline         office,current          short,current           <string,string>
Once you decide which trace you wish to view, you can then specify it as seen below. Ensure that you select the trace type and whether or not you wish to view the current (most recently run) trace. Events are listed in the order of the closest to furthest distance from the originating point of the OTDR trace.
CDC_EAST_65R4_0001# show slots 1 inventory otdr 54 trace-event long,current

slots 1 inventory otdr 54 trace-event long,current
+----------------------------------------+
| Name            | Value                |
+----------------------------------------+
| trace-type      | long                 |
| trace-tag       | current              |
| trace-date-time | 2023-06-14T19:43:00Z |
| num-event       | 6                    |
+----------------------------------------+

slots 1 inventory otdr 54 trace-event long,current events
+-------------------------------------------------------------------------+
| event-num | event-type | event-distance | event-reflection | event-loss |
+-------------------------------------------------------------------------+
| 1         | loss       | 41211          | -38.75           | 0.40       |
| 2         | loss       | 61437          | -38.75           | 2.50       |
| 3         | loss       | 81213          | -38.75           | 0.80       |
| 4         | reflection | 88483          | -38.47           | 0.10       |
| 5         | reflection | 93213          | -37.74           | 0.50       |
| 6         | reflection | 99152          | -35.84           | 9.30       |
+-------------------------------------------------------------------------+
Viewing OTDR Traces in MCP
To view events in a visual graph in MCP, please see the following article:
MCP-How-to-run-and-view-OTDR-traces-for-RLS
How to Download SOR files
Once the traces complete, use the following CLI command to view the OTDR SOR filename and location and then download the traces to your workstation:
get-otdr-sor-file name "slot-<slot #>-port-<port #>" trace-type <office | short | long> trace-tag current
Example:
RLS# get-otdr-sor-file name "slot-1-port-54" trace-type short trace-tag current
  output:
    result   : success
    url      : /otdr/RLS-1-54-SHORT-CURRENT-2022-06-06T20-38-00Z.SOR
You can use the following command on your workstation to transfer the OTDR SOR files to your workstation:
sftp -P 20022 su@<COLAN-X IP>:/otdr/<OTDR SOR filename> <destination filename>
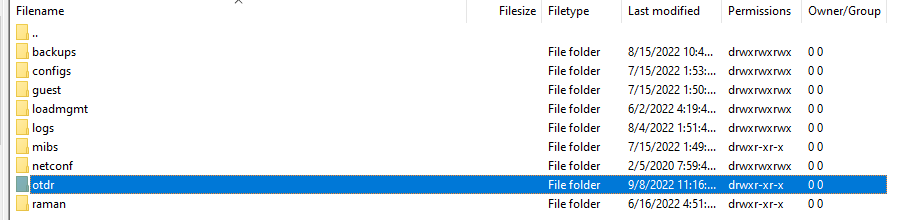
Alternatively you can connect to the shelf via a program like FileZilla using SFTP. When connected you will be able to access all OTDR files in the folder shown below.
When connection make sure in the host field you specify "sftp://" as the prefix for the host and use port 20022.
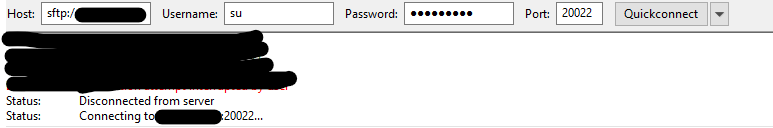
Accept the key for the connection and once connected you will find the OTDR SOR files here:
OTDR Troubleshooting Scenarios
RLS OTDR High Loss and SRA Automatic-ShutoffRLS OTDR fails due to handshake rejected